
Tags
"wind turbines"
The Structure of a Wind Turbine's Vortex
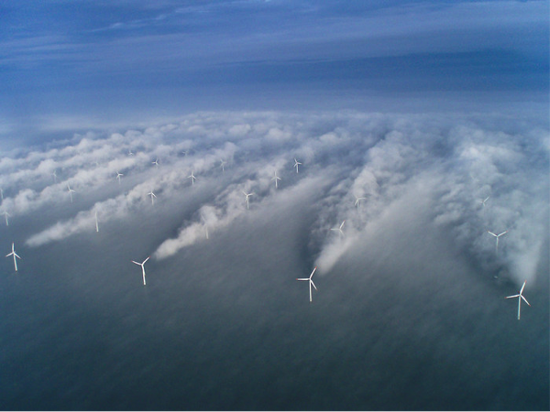
A wind turbine mixes wind into chaotic vortices. These vortices limit efficiencies of the turbines that are located downstream. The tip of the turbine’s blade creates a particularly strong vortex. In the latter part of my research, I have become enthralled with how this vortex’s strength varies across space. This vortex is strongest near the middle of the vortex, and it is weaker farther away. Let us refer to the vortex’s strength as vorticity. Along a line that bisects the vortex, the plot of the vorticity versus the distance is similar to the plot of a Gaussian function, which also known as the normal distribution or the bell curve.
Thus, the vorticity distribution is approximately Gaussian. The reason for this Gaussian approximation is that diffusion smears the vortex out into a Gaussian shape. Diffusion often acts to spread distributions out into Gaussian curves; as you read this sentence, this process occurs around you because diffusion acts to spread heat out towards a Gaussian distribution. Gaussian distributions frequently occur under diffusion because Gaussian convolutions are mathematically simple ways of smoothing out functions. Diffusion spreads a vortex out to a stable, more uniform state by making the distribution into a progressively shorter and broader Gaussian.
Diffusion, however, is not the only force that acts upon a vortex; for interactions between vortices make the vorticity distribution more complicated than a simple Gaussian. A plot of vorticity along a line that bisects a vortex is similar to - yet distinctly different from - a Gaussian. Distributions across various lines differ from Gaussians in different ways. Averaging these plots together gives the graph shown below. The vorticity is normalized by the maximum vorticity of the vortex.
Continue reading The Structure of a Wind Turbine's Vortex